REVERSAL POINT
  • Home
    • Your Support
    • Privacy Policy
    • Terms of Use
    • Contact
  • Monetary Paradox
    • Monetary Wonderland
    • Shirakawa's Monetary Policy Paradox 1
    • Shirakawa's Monetary Policy Paradox 2
    • Minsky's Non-Neutral Money
    • Monetary Policy Paradox
  • Secular Cycle
    • Blog >
      • Bond Wave >
        • Monetary Regime Cycle and BitCoin
        • Paradigm Shifts in Monetary Regime along Bond Wave
    • Supra-secular rhythm
    • Secular Rhythm of Bond Wave >
      • Bond Wave Mapping 1: Paradigm Transformation in Interntional Monetary Regime
      • Bond Wave Mapping 2: Price & Inflation Cycles
      • Bond Wave Mapping 3: Private Debt Cycle
      • Bond Wave Mapping 4: Fiscal Cycle & Negative Real Yield Cycle
      • Bond Wave Mapping X: Political Cycle
      • Limited Gold Supply was a perennial problem for the Gold Standard: in search for Elastic Money and Scalability
  • Political Philosophy
    • Zeitgeist Zero Hour: Intro
    • Socrates Constitutional Cycle >
      • Socrates' Constitutional Cycle
      • Intrinsic value of Socrates Cycle
      • Contrast between Socrates vs Aristotle
    • Can we preserve democracy? >
      • Terminal Symptom of Democracy in Ancient World, Theoretical Views
      • Paradox of Equality & Aristotelean Paradox Management
      • Aristotelean Preservation of Constitutions
      • Contemporary Liberal Representative Democracy?
    • Old Contents >
      • Socrates' 5 Political Regimes
      • Socrates-Homer Hypothesis
      • Crassus & Trump: Socrates-Homer Hypothesis in Modern Context
  • Others
    • Price Evolution >
      • Oligopoly Price Cycle
      • Deflation >
        • Zero Boundary
        • Anecdote 1874-97
        • Deflationary Innovation
    • Innovation >
      • Introduction AI & ML & DL >
        • Chap1 ML Paradigm
        • Chap2 Generalization of ML
        • Chap3 DL Connectionism
        • Chap4 DL Learning Mechanism: Optimization Paradigm
        • Chap5 DL Revolution
        • Chap6 DL Carbon Footprint
        • Chap7 DL Underspecification
        • Chap8 CNN & Sequence Models
      • Map Risk Clusters of Neighbourhoods in the time of Pandemic
      • Confusing Blockchain >
        • Chapter 1: Linguistic Ambiguity
        • Chapter 2: Limitations in Consensus Protocols
        • Chapter 3-1: Disintermedition Myth-conceptions
        • Chapter 3-2: Autonomous Self-regulating Governance Myth-Conceptions
    • Environmental Distress >
      • Model Risk and Tail Risk of Climate-related Risks
  • Socrates' Constitutional Cycle


Shirakawa’s
Monetary Policy Paradox (Part II)


Particularities in Empirical Monetary Policy Paradox:
Japan’s Experience (1980s-2000s)


Originally published August 28, 2017
Edited August 30, 2017

By Michio Suginoo

The previous reading visited Shirakawa’s past statements and made an overview on the architecture of Shirakawa’s Monetary Policy Paradox: how the monetary policy paradox unfolds from a victory to its self-defeating consequence. It provides us with a general economic perspective of the monetary policy paradox.

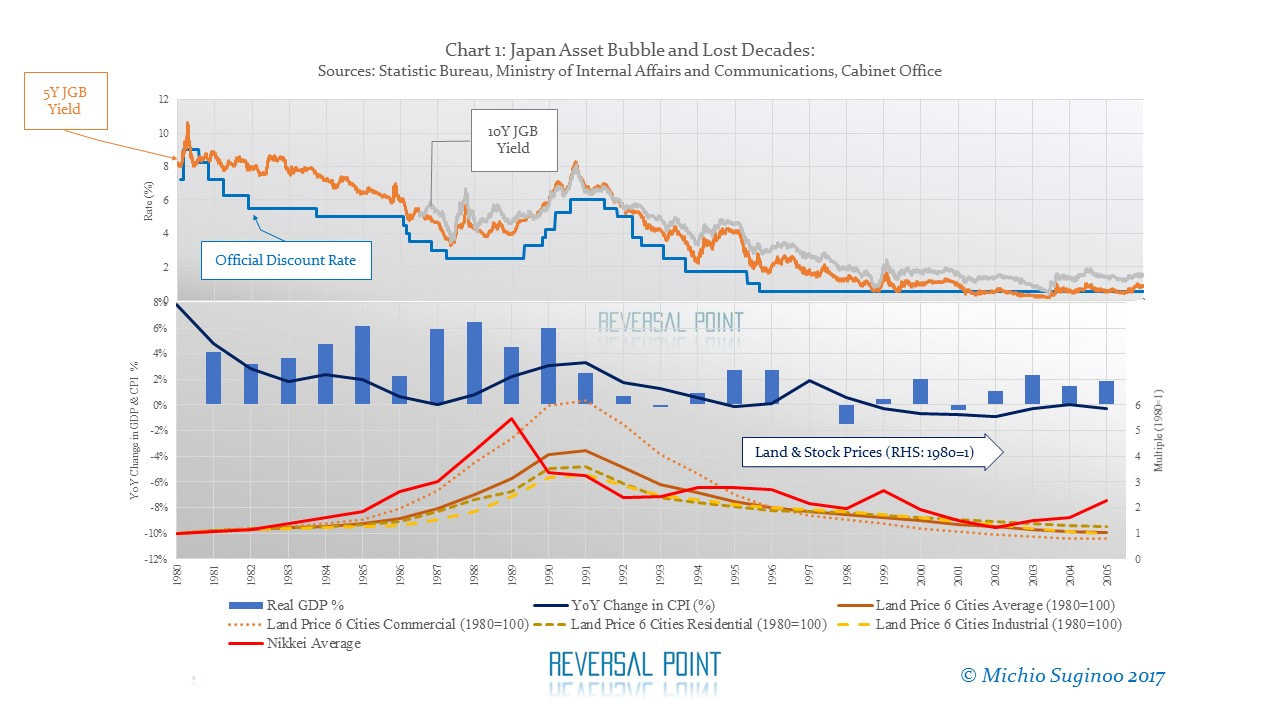
However, in reality, a particular set of conditions could alter the course of economic events and create a particular path for an unfolding financial crisis in the aftermath of a bubble burst. Particularity might be present in economic, social and political conditions. Particular foreign demands can alter the domestic economic conditions. Policy responses are influenced and constrained by particular social and political conditions. Those particularities could significantly differ from one country to another and from one period to another. In order to better analyse each case of financial crisis, it is imperative for us to distinguish between the general architecture of Shirakawa’s Monetary Policy Paradox and a particular set of relevant conditions that each case imposes.
 
Empirical study on specific historical experiences can provide materials for us to understand how particular conditions can shape the course of events along the general architecture of monetary paradox. This reading examines Shirakawa’s Paradox from an empirical point of view. It attempts to observe evidences of the paradox along the empirical chronology of a specific historical experience of Japan during the period between the 1980s and the 2000s.

[1] An Empirical Chronology:
Japan's Experience of Asset-Bubble and Bust


Phase I: Success of Monetary Policy
the late 1970s to the first half of the 1980s

Japan’s economy experienced a decade of high growth rate at 5.2% annual average during the 1970s. Together with oil shocks, the 70s was inflationary. In this backdrop, monetary policy was restrictive and price behaviours and interest rates responded accordingly. The narrative below refers to Chart 1.

  • Monetary Policy: Bank of Japan (BoJ), in its attempt to contain inflation, raised its official discount rate (the short term interest rate) up to 8.9% by 1980.
  • General Price: During the first half of the 80s, the efforts of monetary policy took effect and brought down CPI around 2% level.
  • LTBY: Long term bond yields gradually followed the suit and came down from 10% level in 1980 to 6% level toward the middle of the decade.
  • GDP Growth: GDP growth during this period demonstrates resilience. As monetary policy managed to contain inflation, GDP growth made a rebound without registering a negative record.
  • Asset Price: During this period, asset prices start taking off.

During this phase, monetary policy proved to be very effective in containing general price inflation and restoring the health of Japan's economy.
Picture


Phase II: Formation of Economic Imbalances
the second half of the 1980s and 1991

Entering the second half of the 1980s,

  • Monetary Policy: During the second half of the 80s, monetary policy eased further and brought down the short term interest rates to 2.5% in April 1987 and maintained it for two years until April 1989.
  • LTBY: Long term bond yields followed suit and bottomed around 3.5% before stabilizing in the range between 3.8% and 6.5%.
  • General Price: Entering the second half of the 80s, CPI bottomed at 0% in 1987. Even after asset price surged, CPI inflation became anchored below 3% during this period. Overall, the bubble period did not experience a conspicuous general price inflation.
  • GDP Growth: The annual average of GDP growth during the second half of the 1980s was 5.1%; the annual average for the entire decade was 4.4%. This fact evidences the relative strength of the second half in comparison with the first half: in other words, the effectiveness of the preceding monetary policy in achieving economic stability and engendering excess optimism.
 
Shirakawa states:

This situation, albeit good in itself, fomented excessive optimism about Japan’s higher potential growth and, together with the influence of prolonged easy monetary policy, contributed to the creation of economic bubbles of unprecedented scale in the latter half of the 1980s. (Shirakawa, October 9, 2012, p. 2)

In this setting, an economic imbalance started manifesting itself in asset prices. A stimulative monetary environment together with a sense of economic stability encouraged finance-fed asset inflation. The sense of stability transforms to be economic euphoria.
  • Asset Price: Credit extensively expanded and asset prices surged: for stock price, Nikkei Average peaked in 1989, multiplying 5 fold from its price in 1980; commercial land price of 6 major cities multiplied 6 fold from 1980 to 1991; residential land price of 6 major cities multiplied 3.6 fold from 1980 to 1991. Here, 6 major cities include Tokyo, Nagoya, Yokohama, Osaka, Kyoto, and Kobe.
In the absence of conspicuous general price inflation, asset prices surged. In brief, Japan’s bubble experience was an asset price inflation, but not general price inflation. General price inflation, in a way, lagged behind asset inflation. Shirakawa articulates that this lag in CPI inflation accounted for the delay in BoJ’s response to the over-heated economy.

In fact, excluding one source of information, all of the economic data such as high growth, tight labour markets, surge in bank lending and bloated asset prices were pointing to the need for withdrawing accommodative monetary policy. The only exception was the rate of inflation. Stable prices were a strong rebuttal against the Bank of Japan, which was trying to take away monetary ease. (Shirakawa, April 22, 2010, p. 487)

Japan’s experience reveals that difference in behaviours between general price and asset price presents difficulty in managing monetary policy.

  • In 1989, one year prior to the turn of the 1990s, the monetary policy reversed its course to gradually increase the short-term interest rate.
  • On the very last trading day of the year 1989, Nikkei Average was the first one to react to the new tightening of monetary policy. On the 29th of December 1989, it made its peak. Then, it made a descent in the following year.

Phase III: Burst of Bubble and Its Aftermath--
the 1990s

As the new monetary tightening started taking effect at the turn of the 90s, the asset prices burst. The collapse of the asset prices transformed Japan’s macro psychology from over-confidence of the 80’s to under-confidence of the 90s.

  • Asset Price: It was asset price deflation that characterised Japan’s experience of the aftermath of the bubble bust, rather than general price deflation. After peaking in 1991, asset prices plunged from their highs: until 1999 commercial properties of 6 major cities dropped by 78% to 22% of its peak value; residential properties of 6 major cities dropped by 53% to 47% of its peak value. The asset prices further deflated in the next decade to arrive slightly above the levels of pre-bubble prices.
  • GDP Growth: The average Real GDP growth rate fell from 5.1% during the second half of the 1980s to 1.5% during the decade of the 1990s. This fact evidences how acute the negative impact of the bubble burst of 1991  on GDP was. That said, surprisingly, the deleveraging process did not drag the real GDP into the negative territory for the first 7 years after the collapse of the asset price, in other words until 1998.
  • General Price: The bust of asset bubble reduced inflation rate, but did not yield deflation right away. During the first 7 years, inflation rate was suppressed, but remained positive within a lower range, with an exception of deflation -0.1% in 1995. Deflation exerted its persistence after 1999, 8 years after the bust of asset price.
  • Bifurcation Event: The failure of Yamaichi Securities, Co., Ltd. (Yamaichi Securities) in 1997 marked the emergence of financial crisis. The burst of bubble in 1991 only yielded the problem of asset deflation for the first 6 years. Until the failure of the security firm in 1997, financial crisis and deflation were not conspicuous. In this regard, the failure of the security firm in 1997 divides the post-bubble era of Japan into two periods—the period between 1991 and 1997 and thereafter. The former period is the latent period in which only asset deflation unfolded. The latter period unfolded financial crisis.

The time lags, from the time of the collapse of asset bubble to the times of the emergence of the negative GDP growth and persistent deflation, 7 years and 8 years respectively, illustrate particular characteristics of Japan’s post-bubble experience.

  • Monetary Policy: In hindsight, the failure of Yamaichi Securities materialized after monetary policy brought down the short term interest rates at the bottom of 0.5%. Since then, GDP growth rate remained stagnated and hovered between the negative and the positive territories. This evidenced the diminishing effectiveness of monetary policy in the deleveraging paradigm.

Phase IV: Aging Demographic--
the 2000s

Entering the first half of the 2000s, almost a decade after the burst of asset bubble in 1991, GDP Growth further stagnated and deflation continued. The annual average growth rate declined form 1.5% during the decade of the 90s to 0.6% during the 2000s. Shirakawa argued that the negative deleveraging effect on the growth has already diminished in the 2000s. He attributed the deteriorating stagnation to Japan’s aging demographic. This point is discussed later in the section of “Particularity of Japan’s Financial Crisis Experience” in this reading.


[2] Particularity of Japan’s Financial Crisis Experience

Shirakawa points out particularities of Japan’s experience in the post-bubble deleveraging economy after 1991. Those particularities differentiate Japan’s experience from other historical cases. We make a brief look at some of them below.

(1) The Latent Period: Global Growth

The latent period for Japan’s financial crisis—the time lag of, from the time of the collapse of asset bubble to the times of the emergences of the negative GDP growth and deflation, 7 and 8 years respectively—is relatively long.
 
To make a contrast, Shirakawa refers to the case of the Global Financial Crisis. The US house price peaked around August 2006, thereafter, started collapsing. After Lehman Brother failed in 2007, the quarterly US Real GDP growth rate entered into the negative territory in the 1st quarter and the 4th quarter of 2008, -2.3% and -8.2% respectively. The materialization of deflation lags until the 4th quarter of 2008. According to this chronology of the US case, the latent period is merely an order of 2 years. There is a clear contrast in the latent period between these two cases—6 years for Japan and 2 years for US.

Shirakawa made a contrast between these two mutually independent experiences and made his remarks on the following two factors:

  1. Global Growth in the post bubble economy: After Japan’s bubble burst, the global growth remained in the range between 2% and 4% throughout the 90s. Japan’s export benefited from this relatively strong global growth. On the other hand, the US experience, triggering a global economic crisis.  On the other hand, the US experience, triggering a global contagion of the crisis, had to make a progress in the absence of supoport from the global growth.
  2. Accounting Treatment: For Japan’s case, non-performing loan assets were not market to market. It took long time to recognize losses. For US case in the Global Financial Crisis, the value of the securitised products related to sub-prime loans was recognized based on mark-to-market valuation. The collapse in their prices was exposed at the timing of financial statement reporting and intensified market pressures.

(2) Failure of A Securities Firm:

The policy makers’ handling of the failure of a security firm, Yamaichi Securities, Co., Ltd., that took place in 1997 was particular to Japan’s experience of the post-bubble financial crisis. In his statement below, Shirakawa assesses the net benefit of the bailout of the failed securities firm and concludes “the benefit of preventing systemic risk from materializing far exceeded such costs.”

The first difference is the fact that Japan never became the epicenter of a global financial crisis.  The most important reason for this is that the Japanese authorities did not allow the disorderly failure of financial institutions.  In this regard, the most challenging time for Japan was 1997, when the brokerage Yamaichi Securities, with assets of 3.7 trillion yen or 19 billion pounds at that time, collapsed.  Yamaichi Securities also had sizeable presence internationally, especially in the European capital markets.  At that time, as was the case when Lehman Brothers failed, Japan did not have a bankruptcy law that enabled the orderly resolution of securities companies.  Given such circumstances, the Bank of Japan decided to provide an unlimited amount of liquidity to Yamaichi Securities.  This measure essentially enabled an orderly resolution by replacing all exposures to the securities company held by market participants both domestic and overseas with exposures to the Bank of Japan and so prevented the materialization of systemic risk.  This was truly a tough decision for the Bank of Japan.  It was made without knowing whether the institution was solvent or insolvent, and eventually resulted in some losses.  I would say, however, that the benefit of preventing systemic risk from materializing far exceeded such costs.  As a result, Japan did not experience a sharp and significant plunge in economic activity like the one that followed the collapse of Lehman Brothers, and negative impact from financial turmoil in Japan did not spread to the rest of the world. (Shirakwa, January 10, 2010, pp. 4-5)

The ability of policy makers to conduct flexible and immediate policy actions also depends on the social and political constraints. Loose social and political constraints, while allowing policy makers to make flexible and immediate actions, have a risk of attracting misconduct and causing principal-agent problem. This is a complicated issue which has no single answer.

(3) Extended Lower Growth—Social Contract:

Shirakawa attributed Japan’s relatively low unemployment in the aftermath of the bubble-burst to its social contract. And, he argued that the social contract has both positive and negative impacts to the economy. (Shirakwa, January 10, 2010, p. 7) 
  • Positive for Social Stability
  • Negative for Reallocation of Resources: Time lag in wage adjustment and inability to fire redundant workers “delayed the necessary reallocation of resources delayed the necessary reallocation of resources to respond to demand and cost changes after the bubble burst.”

(4) Extended Lower Growth in the 2000s—Demographic:

Entering the first half of the 2000s, almost a decade after the burst of asset bubble in 1991, GDP Growth remained stagnated and deflation continued. However, Shirakawa argued that the negative deleveraging effect on the growth has already diminished in the 2000s. He argued Japan’s stagnation is rather due to its aging demographic.
 
He demonstrated a comparison of GDP metrics among different countries during the decade of the 2000s. Figure 1 is an excerpt, Chart 13, from Shirakawa’s paper: “Deleveraging and Growth: Is the Developed World Following Japan's Long and Winding Road?.”
Picture
These charts illustrate three different average real GDP growth metrics during the first decade of the 21st century among advanced economies. The chart on the left compares the real GDP growth rate among advanced economies and shows that Japan’s metrics is at 0.8% and the lowest among peers. This demonstrates the severity of stagnation of Japanese economy. The chart in the middle compares per-capita real GDP growth and shows that Japan’s metrics is at 0.8% and the second lowest among peers. Nevertheless, the right chart demonstrates a different picture. The chart on the right compares per-worker real GDP growth. And Japan’s metric is the top among peers during the decade.
 
During the first decade of the 21st century, while Japan’s entire economy stagnates, its per-worker output is the highest among its peers. In other words, this contrast—between the first two charts and the chart at the right— reveals the aging demographic, but not per-worker output, compresses Japan’s output and accounts for the economic stagnation.
 
Shirakawa’s growth analysis debunks a prevalent myth of Japan’s lost decades. These three charts indicate that Japan’s low growth is not necessarily due to prolonged negative impact of deleveraging process.
 
This section took a look at some of particularities of Japan’s experience in its post-bubble deleveraging paradigm. These, albeit not being a comprehensive list, gave us a great insight about how particular conditions can affect the course of event within the general architecture of Shirakawa’s Monetary Policy Paradox. This section reminds us of the importance of understanding particular conditions, which are present in political, social, and economic realities, as well as the general framework of the monetary policy paradox in order to analyse financial crises.

References:
  • Shirakawa, M. (2002). One Year Under Quantitative Easing. Tokyo: INSTITUTE FOR MONETARY AND ECONOMIC STUDIES, Bank of Japan.
  • Shirakawa, M. (April 22, 2010, 3 13). Revisiting the Philosophy behind Central Bank Policy. International Finance, 485-493. doi:10.1111/j.1468-2362.2010.01271.x
  • Shirakawa, M. (October 9, 2012). Evolution of the Bank of Japan's Policies and Operations: Looking Back on Fifty Years of History. 2012 Annual Meetings of the IMF/World Bank Group. Tokyo: Bank of Japan.
  • Shirakwa, M. (January 10, 2010). Deleveraging and Growth: Is the Developed World Following Japan's Long and Winding Road? Lecture at the London School of Economics and Political Science. Tokyo: Bank of Japan.

​Copyright © 2015-2017 by Michio Suginoo. All rights reserved.

Proudly powered by Weebly