REVERSAL POINT
  • Home
    • Your Support
    • Privacy Policy
    • Terms of Use
    • Contact
  • Monetary Paradox
    • Monetary Wonderland
    • Shirakawa's Monetary Policy Paradox 1
    • Shirakawa's Monetary Policy Paradox 2
    • Minsky's Non-Neutral Money
    • Monetary Policy Paradox
  • Secular Cycle
    • Blog >
      • Bond Wave >
        • Monetary Regime Cycle and BitCoin
        • Paradigm Shifts in Monetary Regime along Bond Wave
    • Supra-secular rhythm
    • Secular Rhythm of Bond Wave >
      • Bond Wave Mapping 1: Paradigm Transformation in Interntional Monetary Regime
      • Bond Wave Mapping 2: Price & Inflation Cycles
      • Bond Wave Mapping 3: Private Debt Cycle
      • Bond Wave Mapping 4: Fiscal Cycle & Negative Real Yield Cycle
      • Bond Wave Mapping X: Political Cycle
      • Limited Gold Supply was a perennial problem for the Gold Standard: in search for Elastic Money and Scalability
  • Political Philosophy
    • Zeitgeist Zero Hour: Intro
    • Socrates Constitutional Cycle >
      • Socrates' Constitutional Cycle
      • Intrinsic value of Socrates Cycle
      • Contrast between Socrates vs Aristotle
    • Can we preserve democracy? >
      • Terminal Symptom of Democracy in Ancient World, Theoretical Views
      • Paradox of Equality & Aristotelean Paradox Management
      • Aristotelean Preservation of Constitutions
      • Contemporary Liberal Representative Democracy?
    • Old Contents >
      • Socrates' 5 Political Regimes
      • Socrates-Homer Hypothesis
      • Crassus & Trump: Socrates-Homer Hypothesis in Modern Context
  • Others
    • Price Evolution >
      • Oligopoly Price Cycle
      • Deflation >
        • Zero Boundary
        • Anecdote 1874-97
        • Deflationary Innovation
    • Innovation >
      • Introduction AI & ML & DL >
        • Chap1 ML Paradigm
        • Chap2 Generalization of ML
        • Chap3 DL Connectionism
        • Chap4 DL Learning Mechanism: Optimization Paradigm
        • Chap5 DL Revolution
        • Chap6 DL Carbon Footprint
        • Chap7 DL Underspecification
        • Chap8 CNN & Sequence Models
      • Map Risk Clusters of Neighbourhoods in the time of Pandemic
      • Confusing Blockchain >
        • Chapter 1: Linguistic Ambiguity
        • Chapter 2: Limitations in Consensus Protocols
        • Chapter 3-1: Disintermedition Myth-conceptions
        • Chapter 3-2: Autonomous Self-regulating Governance Myth-Conceptions
    • Environmental Distress >
      • Model Risk and Tail Risk of Climate-related Risks
  • Socrates' Constitutional Cycle

Article 3-3
​Deflation Anecdote 1874-1897:
 
Integration, Convergence, & Deflation

Originally published February 2, 2015
​Last edited: December 8
, 2016
By Michio Suginoo


[1] 1874-96: Benign Deflation from GDP perspective; 
Malign Deflation from Unemployment perspective

 
Besides monetary reasons, deflation can be caused by either negative demand shock or positive supply shock. In a rudimentary neoclassical synthesis, in the former case, with other factors constant, a negative demand shock would shift the demand curve to the left: therefore, this sort of demand-driven deflation would be accompanied by negative GDP growth. In the latter case, with other factors constant, a positive supply shock would shift the supply curve to the right: therefore, deflation would be accompanied by positive GDP growth. Hence, from a GDP perspective, rudimentary neoclassical synthesis (1) would characterise demand-driven deflation as malign and supply-driven deflation as benign in a simplistic manner. In reality, the two causes might be present themselves as a mix.
​
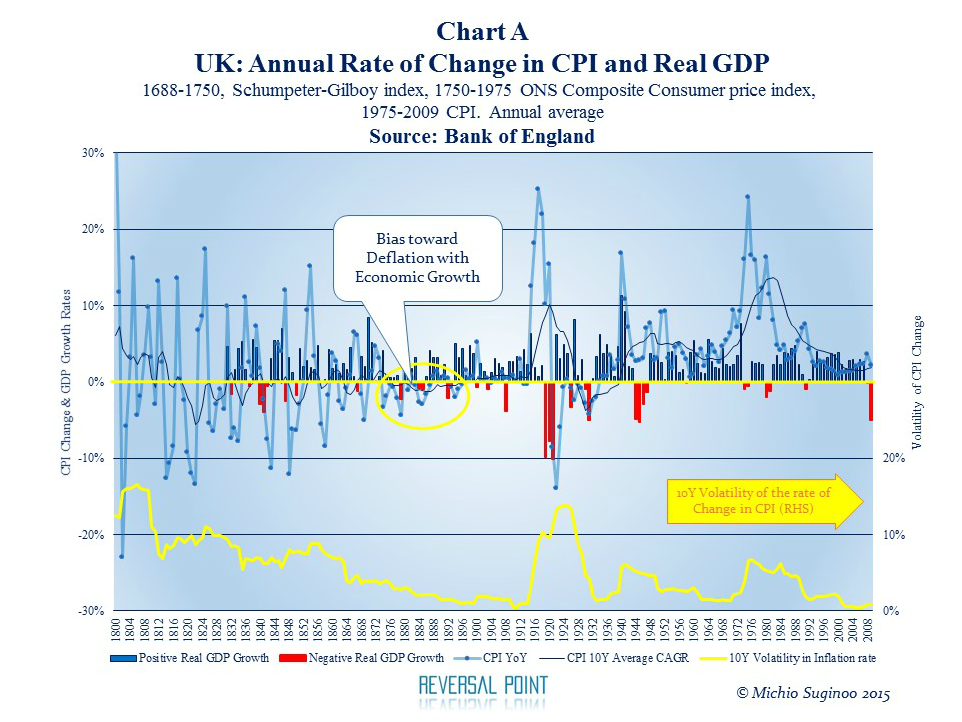
Here, let us observe the deflation episode of the late 19th century in the UK. Chart A illustrates the history of both inflation and GDP growth in the UK since the turn of the 19th century. The last three decades of the 19th century provide us with a case of a relatively benign deflationary period from an output perspective.

​On a year-over-year basis, the period between 1874 and 1896 was characterised by frequent and longer deflation, mixed with occasional low inflation. In this sense, this period is characterized to have deflationary bias, at a moderate level. The average inflation rate over the period was negative, at a moderate level of -0.7% (at compound annual growth rate or CAGR). Between 1877 and 1896, the 10-year inflation rate average remained below zero without interruption. The 10-year average of inflation volatility continued to level down. During this period of deflationary bias, real GDP growth was overall positive at 1.7%, with some occasional, mildly negative years: years with negative real GDP growth below -2% were 1879, at -2.21%, and 1892, at -2.07%. Overall this period appears to be a case of a benign deflation from an output perspective.

1874-97 Period, deflation

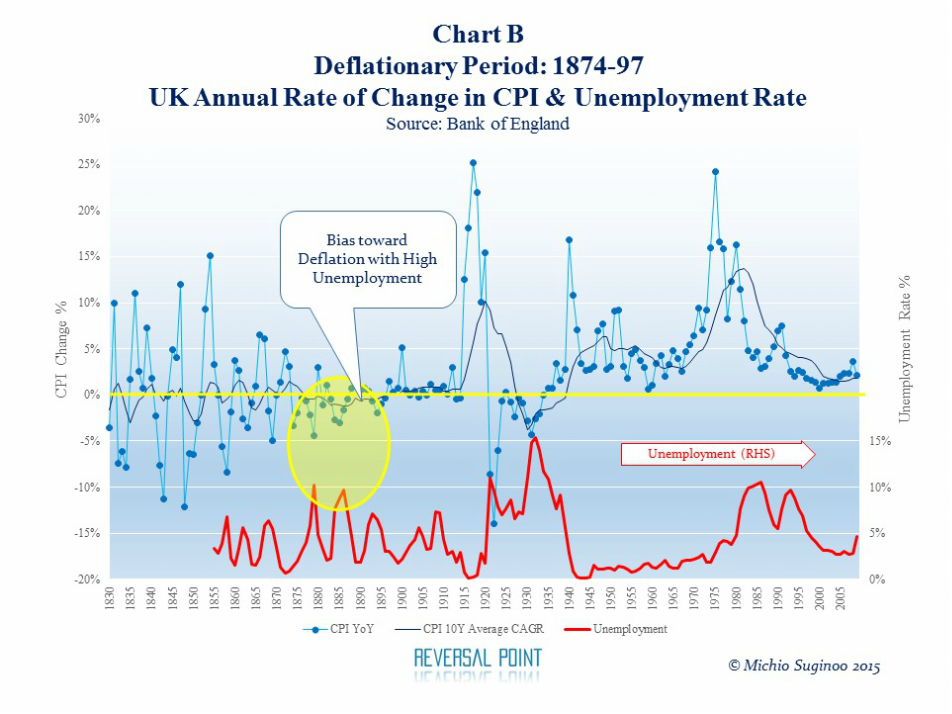
However, this same period appears to be very different from an employment perspective. Chart B illustrates deflation and unemployment records dating back to 1850 using the data series compiled by the Bank of England (BoE). 

Defation, Unemployent

The last quarter of the 19th century experienced severe unemployment (above 7%) during deflation, in 1879, 1884-1887, and 1893. This suggests that from an unemployment perspective, the deflation during this period is malign: it appears contrary to the perspective of real GDP growth.
​
The deflation case of this period possesses a contradictory complexity in its nature: benign from a real GDP perspective and malign from an unemployment perspective.
The remaining content below contemplates the background of this persistent deflationary period during the classical gold standard era. What was happening during this time?


[2] Monetary Integration

Throughout the last three decades of the 19th century, a number of transformational events took place to shape a new international monetary system.

Against the backdrop of the convergence movement, there were major territorial consolidation movements across European states, involving wars. Bismark of Prussia embarked on the consolidation of German speaking regions by engaging in three wars: the Danish-Prussian War in 1864, the Austria-Prussian War in 1866, and the Franco-Prussian War in 1871. Germany was unified in 1871. Liberalization movements to free Italian states from foreign powers, Resorgimento, transformed into a unification movement. In 1871, upon selecting Rome as its capital, Italy was unified.

During these consolidation wars, the major states in continental Europe suspended their monetary systems. Before the wars, Europe was divided into various monetary regimes: the German states, the Austro-Hungarian empire, Scandinavia, and Russia were on the silver standard, while the UK was the sole nation on the gold standard. The countries in the Latin Monetary Union—France, Italy, Belgium, Greece and Switzerland—were on bimetallism and in a position to bridge the silver standard and gold standard (Eichengreen, 2008) The wartime suspension of major monetary systems in continental Europe left the gold standard as the only sizable one among operating international monetary systems of the time. As the sole viable survivor, the gold standard had no dominant competitor left.

​After victories in three wars, a unified Germany joined the gold standard, rather than restoring its pre-war silver standard.

​
“The Germans came aboard in 1871, financing their gold reserves with part of the indemnity paid by the French after their defeat in the Franco-Prussian War—an indemnity equal to five billion francs, which was about one-third of France’s total output of goods and services.” (Bernstein, 2000, p. 240: citing Marc Flandreau)

Germany’s move made the gold standard the monetary system with the largest network externalities of the time. Moreover, London’s financial market, the centre stage of the classical gold standard, provided the deepest liquidity for international financial transactions. These factors triggered the subsequent rush into the gold standard as other nations followed suit.
​
According to Hills, Thomas, & Dimsdale (2010), the behaviour of the UK’s domestic economic cycle has transformed since the convergence of international monetary regimes into the classical gold standard since the 1870s. Up until 1878, the UK’s business cycle had been driven by domestic financial crisis. “(A)fter 1878, however, domestic financial crisis appeared to have played a less significant role, reflecting the increasing stability of the United Kingdom’s monetary system. The UK business cycle became more closely aligned with external factors as international linkages became more important following the widespread adoption of the gold standard system of fixed exchange rates.” (Hills, Thomas, & Dimsdale, 2010)

Homer (2005) offered three events to symbolise the beginning of the new era: the opening of the Suez Canal in 1869; the unification of Germany at the end of the Franco-Prussian War in 1870; and the consolidation of the US as an industrial power post-civil war, in 1879. In the new international trade setting, the US and Germany, two newly consolidated big economies, had emerged and began integrating into the global linkage through the classical gold standard. (Homer & Sylla, 2005)

The US, remaining ambivalent between gold and silver under the bimetallic standard during this period, waited until 1900 to officially adopt and legislate the gold standard under the Gold Standard Act of 1900. The US delayed its “official” participation for a few reasons: silver-gold arbitrage opportunities under its bimetallic system made it difficult to defend its gold reserve, when the nation most needed it in crisis; it lacked a central bank; and it had failed to gain credibility among its European peers in order to receive rescue packages in time of crisis (it was a private figure, J.P. Morgan, who finally devised the credibility of the US in the crisis of 1893). Nevertheless, even prior to 1900, the US had a de facto linkage to the gold standard via bimetallism.

Economies among those participants had become inter-linked to each other through the fixed currency exchange against gold.

During the new international monetary linkage, was there any trace of transmission of productivity gain among those new gold standard participants? Technological transfer might explain supply-driven benign deflation among the classical gold standard peers.


[3] Convergence Context: Broadberry’s Historical Analysis

The observations below provide a background picture of technological transformations among three major nations: the US, the UK, and Germany.

“The Civil War introduced capitalism into the South. (… ) By integrating the economies of the South and West with rapidly industrializing North-East, they (railroads) created one national market. A unified common market displaced a series of disparate regional ones. The new national market gave birth to national firms, which either bought out or destroyed the small-scale regional enterprises that characterized the pre-Civil War economy.” (Shaffer, 1983, pp. 4-5)

 “German industry underwent a phenomenal development. Germany soon passed France and England as a producer of iron and steel. Railway mileage trebled between 1870-1914, while the German merchant marine grew fivefold. German foreign trade grew to be almost as large as England’s.” (Homer & Sylla, 2005, p. 252: citing Clough)

Broadberry’s analysis below provides us with additional insight on technological transfer during the convergence of the international monetary regime during 1874-1897.
​
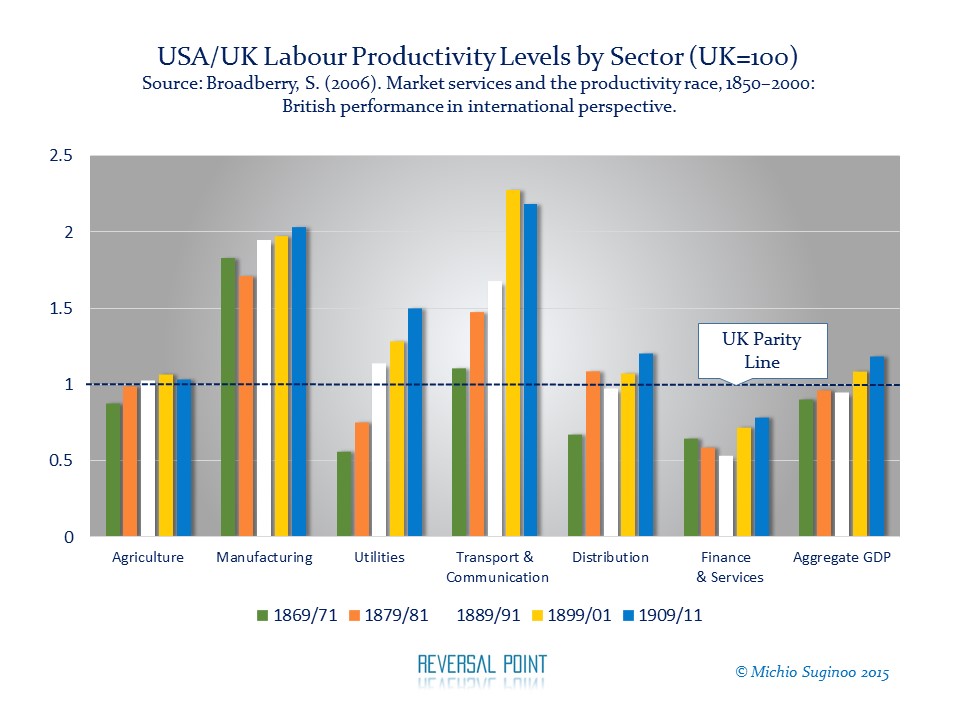
His analysis contrasts the gradation in the relative pace of convergence in productivity gain across sectors among those three countries during this period. Let us skim through Broadberry’s analysis. The next graph illustrates the by-sector labour productivity comparison between the US and the UK. The bar chart represents the labour productivity ratio of the US over the UK.

Picture

  • The UK managed to maintain its productivity lead in the service sector and in aggregate GDP level. “In many ways the period 1850-1914 can be seen as the ‘golden age’ of British commerce, with London remaining firmly at the centre of the networks of world trade and payments. Nevertheless, development had already occurred in the United States to undermine Britain’s dominant position in parts of the service sector.” (Broadberry, 2006, p 83)

  • US labour productivity-gain performance excelled in “manufacturing” and “transportation and communication” in both its extent and its pace, extending beyond the convergence to the UK as the US had already exceeded the UK in labour productivity in those sectors prior to 1878. In particular, the railway sector gave rise to the prototype of the modern business enterprise—high-volume, low-margin, and hierarchical management. On the other hand, it failed to reach the UK finance and service sectors, partly due to domestic regulations. The labour productivity comparison in aggregate GDP demonstrates that the slow catch-up in the US service sector compromised overall productivity progress, dragging it down to below UK parity until 1901, despite its phenomenal labour productivity performance in the industrial sectors. (Broadberry, 2006) ​
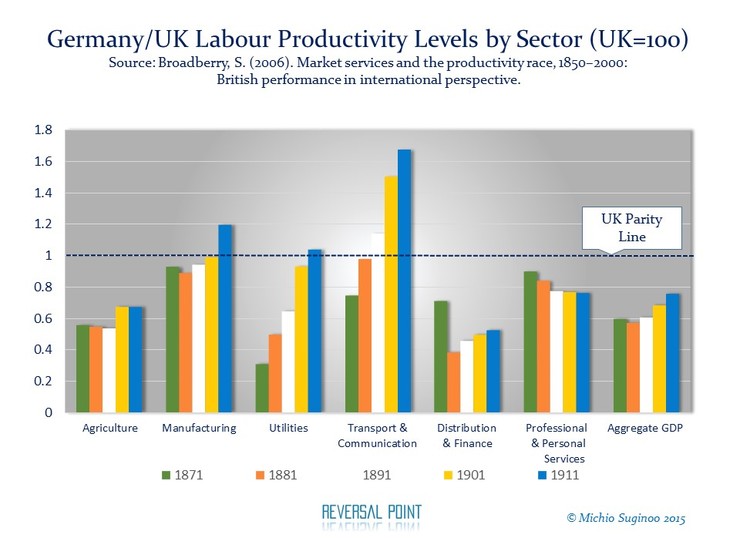
The next graph illustrates the by-sector labour productivity comparison between Germany and the UK. The bar chart represents the labour productivity ratio of Germany over the UK.
Picture

  • Germany: Despite its low aggregate productivity, by 1891, Germany had overtaken the UK in its labour productivity in the transportation and communication sectors. A set of protective measures by the government to strengthen its heavy industry and protect its agricultural sector compromised its opportunity to grow light industries as financial & labour resources were not sufficiently allocated. Based on historical analysis, Broadberry provides his counter-view against the prevalent notion of the strong German economy prior to World War II, saying that  “much less acknowledgment of the costs arising from the protection of agriculture in the face of competition from the New World, and even less recognition of the underdevelopment of services in Germany.” (Broadberry, 2006, p91)
The two charts based on Broadberry’s analysis (2006) suggest that in retrospect, the period in question, 1874-1897, coincided with the convergence in productivity-gains for Germany and the US. This creates room for us to infer that the capital deepening must have been in a premature stage; or, in principle, as “diminishing marginal return to the capital,” if any, must have been offset by the technological advancement in those new emerging economies. 

Citing Chandler that “the standardized, high-volume, low-margin business and multiple operating units managed by a hierarchy of salaried executives, began on the US railways during the late nineteenth century” (2006, p92), Broadberry emphasized the importance of the emergence of the prototype of the modern management that arose from the railway sector. Combined with the development of information and communication technology, the features of modern business developed in railway management were extended to the service sector. (Broadberry, 2006)

The charts presented above are partial excerpts based on the analysis of Broadberry (2006) and omit data on some sectors due to space constraints. For more details on this topic, readers are encouraged to refer to Broadberry’s insightful book, “Market Services and the Productivity Race, 1850–2000; British Performance in International Perspective.”


[4] Colonialism and cheaper labour from the colony:

Ataigawa addressed his hypothetical view of the cause for the deflation during this particular period. He attributed the deflation to colonialism, protectionism, and innovation (2000). 

The expansion of colonial territory provided the ruling powers with cheaper labour and resources in their colonial territories. This is a positive supply shock and serves as one of the most intuitive explanations for the combination of deflation and economic growth supply-driven benign deflation. Whether through colonialism, globalization, or other factors, access to cheaper labour and resources abroad is an intuitive cause for deflation, when other factors are constant.

His reasoning of protectionism accompanies a paradoxical complexity in that protectionism may translate into inflation for domestic price, but could translate into deflation for international price. Further quantitative analysis will be required to conclude the net effect.

Ataigawa attributed the end of deflation around the turn of the 19th century to changes  in colonialism. Further intensification in colonialism combined with more explicit military involvement, especially between Germany and the UK, raised government spending in heavy industries and created a heavy financial burden. This transmitted inflationary forces to the economy and led to reflation to end a long period of deflation. (2000, p. 65) In other words, his view advocates the notion that a massive fiscal expansion led to reflation towards the turn of the 20th century. It was a form of Keynesian stimulus before Keynes’ academic debut.

According to the historical data compiled by the Bank of England, government spending measured in ratio to GDP was as follows: 6.35% in 1890; 6.88% in 1895; 10.38% in 1900; 8.56% in 1905; and 9% in 1910. This does not disagree with Ataigawa’s view. In addition, The Boer War falls into this period. This particular war was related to the scarcity of gold, and was therefore also affected by the monetary regime of the time.

[5] Summary
The integration of the international monetary regime into the classical gold standard, the early stage of convergence in productivity, and the supply expansion through the intensification of colonialism created the context for the last three decades of the 19th century.

These factors might represent elements to account for deflation, and therefore might provide us with a guiding framework to view deflation in our time when we adjust them according to the context. Colonisation, in particular, needs to be replaced by other economic activities of the modern context, such as outsourcing of production factors abroad. Confirming the causality (i.e., determining whether those factors actually contributed to deflation in that period) requires further analysis.


Note:
 (1): Rudimentary in a sense that it conveys a notion that demand and supply would equilibrate at full employment in the long term.

Reference
  • Broadberry, S. (2006). Market Services and the Productivity Race, 1850–2000; British Performance in International Perspective. New York Cambridge University Press

  • Hills, S., Thomas, R., & Disdale, N. (2010). The UK Recession in context– what do three centuries of data tell us? The Quarterly Bulletin 2010 Q4, 277-291. Retrieved from: http://www.bankofengland.co.uk

  • Homer, S. & Sylla, R. (2005). A history of interest rates. (4 ed.). Hoboken, New Jersey: John Wiley & Sons, Inc.

  • Jarvis, J. (2009, June 12). When innovation yields efficiency. Retrieved from: http://buzzmachine.com/2009/06/12/when-innovation-yields-efficiency/

  • Johnson, P. (1997). A history of the American people. New York, Harper Perennial. 

  • Shaffer, E. (1983). The United States and the control of world oil. New York, St. Martin Press, Inc.

  • Stiglitz, J. E. (2012, January).  The book of job. Vanity Fair. Retrieved from: http://www.vanityfair.com

                                  Reference in Japanese
  • Ataigawa, Y. (2005): 安宅川佳之 「長期波動からみた世界経済史」:コンドラチェフ波動と経済システム 京都 ミネルバ書房

​Copyright © 2015 by Michio Suginoo. All rights reserved.

Advance Notification about Disclaimers:
Please read the "Terms of Use" & "Privacy Policy" of the site before you submit any comment.
Your participation in the comment below is deemed an explicit agreement with "Terms of Use" & "Privacy Policy" of the site.
Proudly powered by Weebly