REVERSAL POINT
  • Home
    • Your Support
    • Privacy Policy
    • Terms of Use
    • Contact
  • Monetary Paradox
    • Monetary Wonderland
    • Shirakawa's Monetary Policy Paradox 1
    • Shirakawa's Monetary Policy Paradox 2
    • Minsky's Non-Neutral Money
    • Monetary Policy Paradox
  • Secular Cycle
    • Blog >
      • Bond Wave >
        • Monetary Regime Cycle and BitCoin
        • Paradigm Shifts in Monetary Regime along Bond Wave
    • Supra-secular rhythm
    • Secular Rhythm of Bond Wave >
      • Bond Wave Mapping 1: Paradigm Transformation in Interntional Monetary Regime
      • Bond Wave Mapping 2: Price & Inflation Cycles
      • Bond Wave Mapping 3: Private Debt Cycle
      • Bond Wave Mapping 4: Fiscal Cycle & Negative Real Yield Cycle
      • Bond Wave Mapping X: Political Cycle
      • Limited Gold Supply was a perennial problem for the Gold Standard: in search for Elastic Money and Scalability
  • Political Philosophy
    • Zeitgeist Zero Hour: Intro
    • Socrates Constitutional Cycle >
      • Socrates' Constitutional Cycle
      • Intrinsic value of Socrates Cycle
      • Contrast between Socrates vs Aristotle
    • Can we preserve democracy? >
      • Terminal Symptom of Democracy in Ancient World, Theoretical Views
      • Paradox of Equality & Aristotelean Paradox Management
      • Aristotelean Preservation of Constitutions
      • Contemporary Liberal Representative Democracy?
    • Old Contents >
      • Socrates' 5 Political Regimes
      • Socrates-Homer Hypothesis
      • Crassus & Trump: Socrates-Homer Hypothesis in Modern Context
  • Others
    • Price Evolution >
      • Oligopoly Price Cycle
      • Deflation >
        • Zero Boundary
        • Anecdote 1874-97
        • Deflationary Innovation
    • Innovation >
      • Introduction AI & ML & DL >
        • Chap1 ML Paradigm
        • Chap2 Generalization of ML
        • Chap3 DL Connectionism
        • Chap4 DL Learning Mechanism: Optimization Paradigm
        • Chap5 DL Revolution
        • Chap6 DL Carbon Footprint
        • Chap7 DL Underspecification
        • Chap8 CNN & Sequence Models
      • Map Risk Clusters of Neighbourhoods in the time of Pandemic
      • Confusing Blockchain >
        • Chapter 1: Linguistic Ambiguity
        • Chapter 2: Limitations in Consensus Protocols
        • Chapter 3-1: Disintermedition Myth-conceptions
        • Chapter 3-2: Autonomous Self-regulating Governance Myth-Conceptions
    • Environmental Distress >
      • Model Risk and Tail Risk of Climate-related Risks
  • Socrates' Constitutional Cycle

BOND WAVE MAPPING: CASE STUDY 4
Mapping Government Intervention
Along the Bond Wave
-Fiscal (Sovereign Debt) Cycle &
Debt Magic (Negative Real Yield) Cycle

Originally published July 23, 2016
Last edited July 17, 2017
By Michio Suginoo


Sidney Homer, in his chart of the centennial best credit frontier or “Homer’s Saucer,” left us a notion that the state of money has something to do with the evolution of the Western civilization. Homer’s notion extends to a life cycle of civilization. In studying the bond wave, I intend to contemplate Homer’s notion in a shorter horizon, say secular time frame. Using the bond wave, by observing a long-term transformation in the relationship between bond yields and other metrics for an extended period of time, my attempt is to capture a notion that the state of money mirrors a broader socio, political, and economic reality.

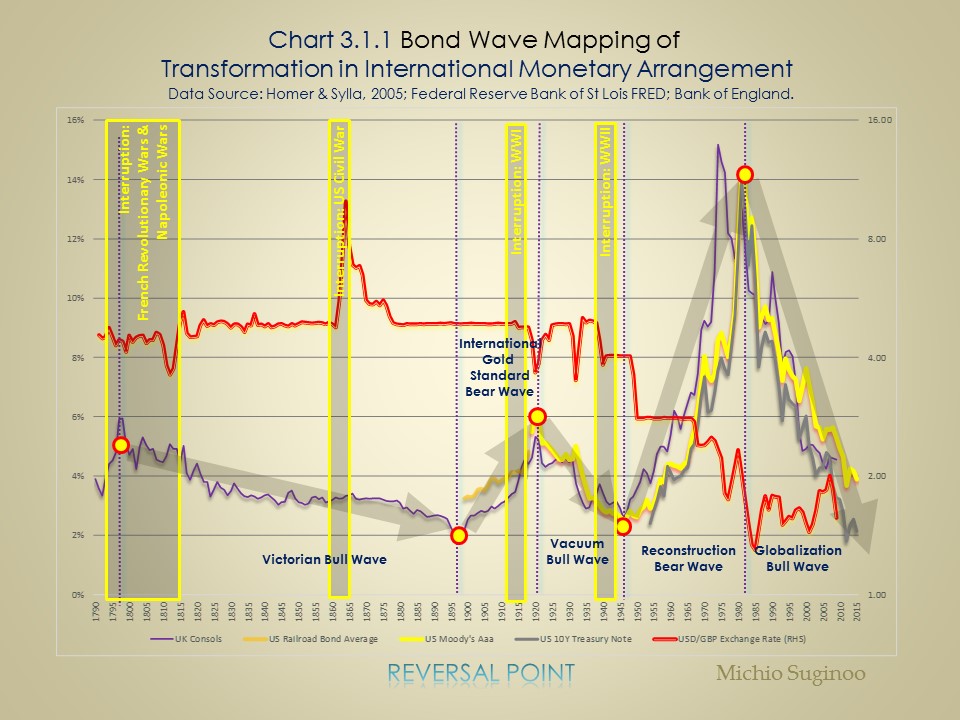
Bond wave mapping provides a heuristic approach to apply historical analogy to make inferences about our present and future based on our past.

This section reviews the cycle of government intervention along the bond wave.

As a reminder, the recent five bond waves are defined as follows:
  • the Victorian Wave from 1798 to 1897;
  • the International Gold Standard wave from 1897 to 1920;
  • the Vacuum Wave from 1920 to 1946;
  • the Reconstruction Wave from 1946 to 1981; and
  • the Globalization Wave, ongoing since 1981.
A more detailed definition of the bond wave is described in Secular Rhythm of the Bond Wave.

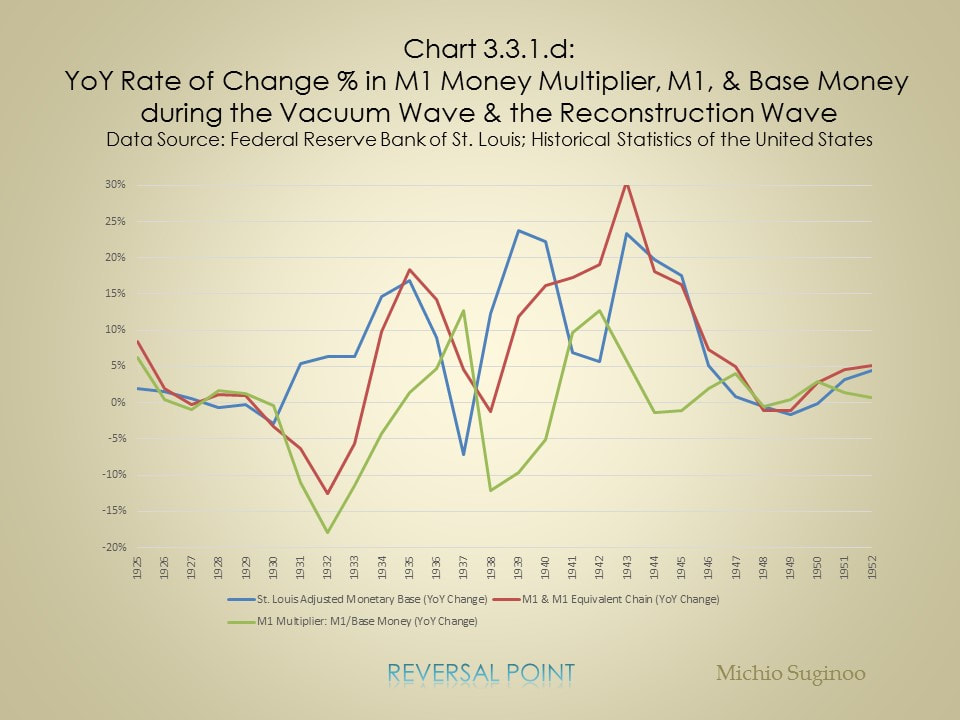
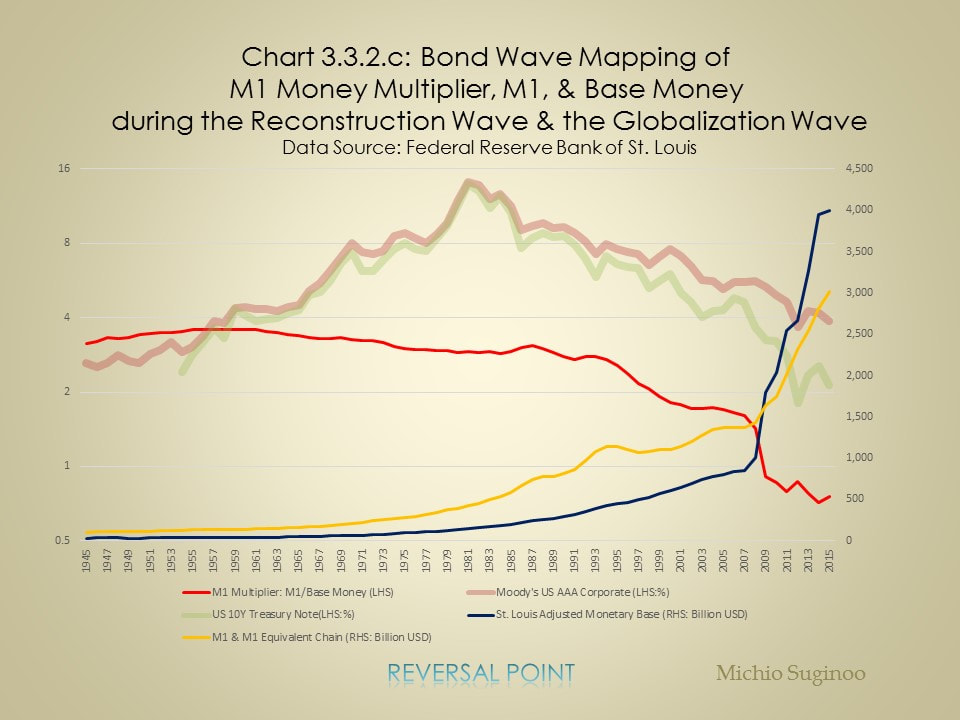
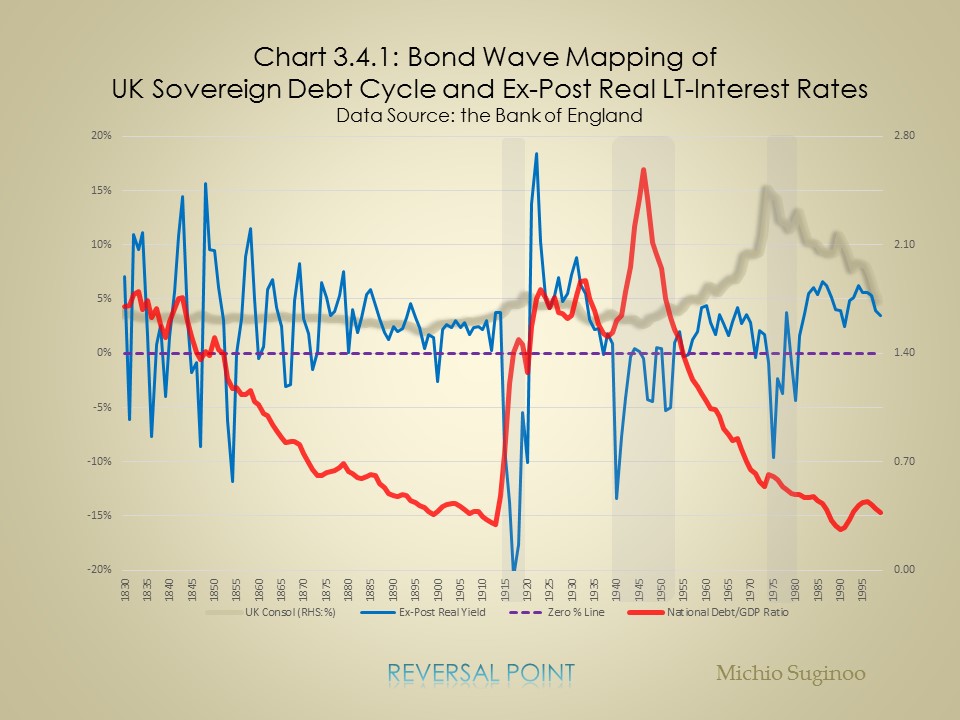
In the aftermath of Global Financial Crisis government intervention took the form of monetary expansion in a historical scale across the advanced economies. During the preceding bull wave, the Vacuum Wave, the managed economy followed economic crisis originated in the stock market crash in 1929, taking another form, fiscal expansion (the New Deal). In both cases, the advanced economies came under managed economy following the cycle of financial crisis. This reading compares these two analogous cases along the bond wave. Of course, government intervention to counter recession came into being in democracy. Before the turn of the 20th century, counter-cyclical government intervention did not exist. It is as if these two episodes imply that the combination of an economic bubble, the consequential deleveraging process, and the reactional managed economy is built into the architecture of one bull wave in the modern democratic system.

Government interventions can significantly alter an economy’s dynamics. The state of our reality “cannot be reduced to [a] purely economic” system (Piketty, 2014, pp. 20, 573-574). Economy does not exist in its pure form, but as a by-product of a variety of interactions with political and social activities—regulations, fiscal and monetary policy, taxation, environmental issues, labour movements, etc.

The bond wave mapping indicates some recurrent notions in the emergence of government interventions during the late stage of the recent bull waves. As an example, the New Deal Policy was introduced from 1933 to 37 during the late stage of the Vacuum Wave; and a series of massive monetary expansions were taken from 2008 to 2016 during the late stage of the Globalization Wave. Although government interventions in economy can take place at any moment, these two episodes have special characteristics to distinguish themselves from others in the context of the bond wave. Both episodes share a special context in terms of the bond wave. These emerged as responses to financial crises that occurred in the middle of bull bond waves. And these measures were mobilised in the context of democracy. Prior to the 20th Century—pre-democratic era—this sort of measure was least likely taken in response to financial crises, This reading overviews the transformation of government interventions along the bond wave.

Why do we care about such things? Positioning at the middle of the late bull wave, we might be able to learn about the prospect in the behaviour of government interventions, from the empirical episodes comparable in the bond wave context.

The Sovereign Debt Cycle

Major significant historical transformations in fiscal behaviour can be captured by historical records of sovereign debt. Charts 3.4.1 and 3.4.2 illustrate the trajectories of sovereign debt-to-GDP ratios and real interest rates along the bond wave for the United Kingdom and the United States, respectively.

Picture
Picture

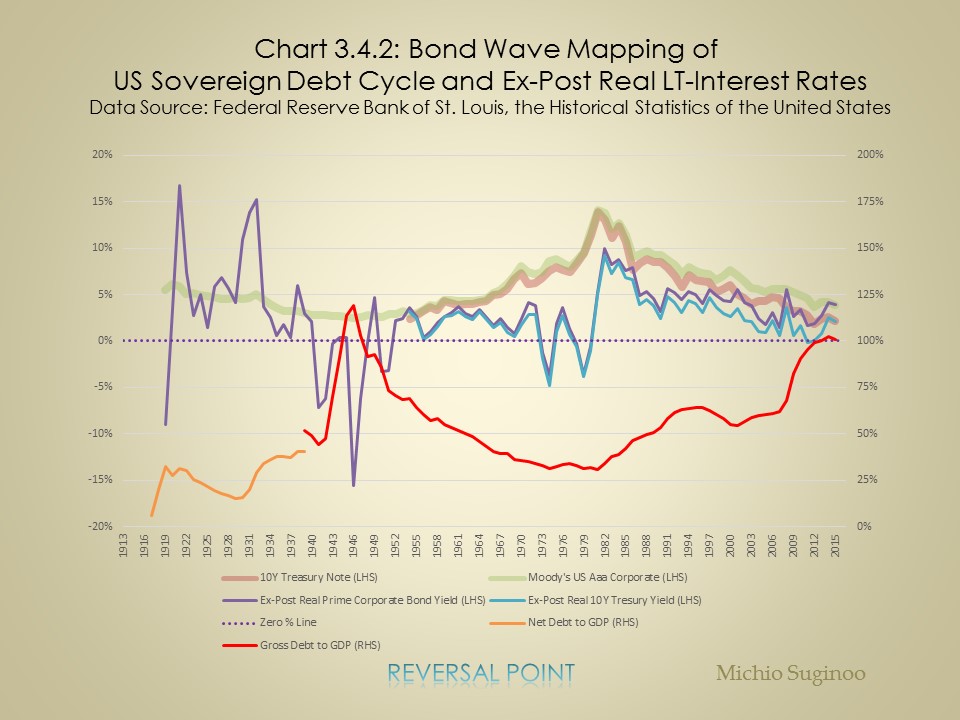
When we look for a similar bond wave location in the previous bull bond wave to our time, a series of government interventions took place in the United States during the period after Black Thursday during the Vacuum Wave:

  • the New Deal programs in the aftermath of the Great Depression;
  • massive fiscal programs and bond yield management during WWII; and
  • negative real interest rates (“inflate away” or financial repression) beyond the bond bull wave into the post-war Reconstruction Wave.

Toward the end of this period, the bond yield made a reversal. Does the empirical experience tell us anything about our future?


War: historical incidences for fiscal expansion

Prior to the Great Depression, large-scale sovereign debt issuance was conducted mainly to finance war— typically for hegemonic wars—but never for economic stimulus. Although some might argue that war is an expression of economic motive, we reserve discussion on this notion in this reading. It was not until the New Deal Policy that a peace-time massive sovereign debt was employed as a countercyclical economic policy tool. In this context, the deflationary environment that lasted throughout the Great Depression and the New Deal exerted a revolutionary power to transform the rhythms of sovereign debt and fiscal management.

According to Joshua Goldstein, the major hegemonic wars coincided with the period of inflation between 1790 and the end of WWI. (Goldstein, 1988, p. 249) Moreover, combining Shiller's Paradox (Shiller, 2015, pp. 42-43)—that is, a relatively high correlation between the inflation cycle (expressed in its trailing average) and the bond wave—with Goldstein’s findings, we can derive the following statistical inference: the major hegemonic wars tended to coincide with the late stages of bond bear waves (within high ranges of the bond wave), where inflation tended to rise. In other words, hegemonic wars tended to emerge at toward the late stage of bear bond waves until WWI. WWII breaches this notion of the bond wave cycle, emerging within the bottom range of the bond bull wave.
 
Despite this breach in the aspect of the bond wave cycle, the impact of WWII was inflationary even in the deflationary environment of the moment.[1] In the aspect of price-behaviour, WWII, together with other precedents, demonstrated consistency in exerting higher inflation after their onset.

The bond wave mapping of the behaviours of the sovereign debts of the United Kingdom and United States are summarised below. 
 
  1. The French Revolutionary Wars, the Napoleonic War, and WWI—three hegemonic wars with direct military involvement in the homelands of top sovereign members of the world system’s hierarchy[2]—broke out toward the top range of both the price cycle and the bond bear wave, and exacerbated inflation. Accordingly, massive emergency fiscal expansions for war funding followed, and manifested as high sovereign debt-to-GDP ratios at a high range of the bond wave.
  2. During the Vacuum Wave, a new trend emerged. A large-scale federal fiscal expansion was deployed for economic recovery, but not for war finance, for the first time. In the US, in terms of debt-to-GDP ratio, the debt expansion in the New Deal policy was comparable to that of WWI. The first peace-time massive fiscal expansion was conducted to counteract the severe systemic economic distress caused by debt deflation during the Great Depression. For the United States, this is a unique case in terms of high debt-to-GDP ratio: it broke the convention by emerging during the deflationary environment within a lower range of the bond wave, distinguishing itself from precedents. On the other hand, the United Kingdom responded to the Great Depression with currency devaluation rather than massive fiscal expansion[3]. (Eichengreen, 2008, p. 87) It waited until the Reconstruction Wave to deploy its first peace-time fiscal expansion. Nevertheless, the UK’s first case also unfolded within a lower range of the bond wave during the Reconstruction Wave.
  3. WWII breached the convention of the war cycle described above in (1) by breaking out during the deflationary environment, at the bottom range of the bond wave, indicating some structural change in the conduct of war. Accordingly, the fiscal expansion for WWII funding coincided with the lower range of the bond wave.
  4. For the case of the Global Financial Crisis, a massive monetary expansion was initiated to generate inflation in its aftermath. This is in line with the motive behind the creation of negative real interest rates, discussed below.
In brief, the timing of high sovereign debt-to-GDP ratios appears to have shifted from the top range to the bottom range of the bond wave. This transformation is in conjunction with a political regime shift toward the universal suffrage movement.


The rise of universal suffrage and labour power

In 1897, universal suffrage enfranchising women was introduced for the first time in history in New Zealand. Then, after the collapse of monarchy regimes in Europe at the end of WWI, rising labour power gained influence on policy-making in most Western societies.

These developments imply a structural shift in fiscal decision-making. Since then, the scope of fiscal behaviour has extended beyond war funding to include peace-time economic stimulus during extreme economic distress. When we map the behaviour of fiscal management over the bond wave, this transformation is visually apparent.

Repeatedly, New Deal programs emerged following the Great Depression to counteract the aftermath of a private debt cycle. This historical development emphasized the fact that the fiscal cycle could evolve in response to the private debt cycle.

As we saw in the previous section (focusing on bond wave mapping over the private debt cycle), the private sector’s debt money dynamisms drove its passage from a leveraging process to a deleveraging process, as Hyman Minsky encapsulated in his remark that “stability is destabilising.” A long period of stability leads to a build-up of destabilizing forces—a high level of leverage in the system—which, in its reversal, triggers a debt deflation period, and subsequently a protracted balance sheet recession. Against this backdrop, the new political setting of democracy introduced historical massive fiscal expansions to counteract economic distress and restore the economy.


Historical differences in intervention responses

Here is a brief recap of differences in the U.S. government intervention responses between these two crises.
Picture
1) Case of the Great Depression:
  • Monetary policy (Chart 3.3.1.d): At the early stage of the Great Depression, the monetary base was not sufficiently increased by the monetary authority: it was increased by just 15% (from USD 6.06 billion in 1929 to USD 7.02 billion in 1933). An increase in the monetary base lagged in time until the New Deal programs.
  • Fiscal policy (Chart 3.3.1.d): The massive fiscal expansion of the New Deal program improved the money multiplier for a short period of time, but proved unsustainable. It was the massive fiscal expansion during WWII that improved the money multiplier. After the end of WWII, the money multiplier managed to maintain a sustainable effect.
  • Currency Regime (Chart 3.1.1): In the early stage of the Vacuum Wave, the United States and the United Kingdom made great efforts to restore and maintain the gold standard. Nevertheless, in September 1931, the British government suspended the gold convertibility to counteract the negative economic consequence arising from the systemic banking crisis, which emanated from the collapse of the Austria Creditanstalt on May 1931. The UK devaluation alleviated the deflationary consequences. The United States waited for the inauguration of FDR to suspend the gold standard. Until then, the fixed exchange regime imposed by government choice, the gold standard, caused a deflationary force and exacerbated the negative economic consequence in the United States.
Picture
Picture
2) The case of the Global Financial Crisis:
  • Monetary policy (3.3.2.c): From the early stage of the Global Financial Crisis, the monetary authority boosted the monetary base in its attempt to restore money circulation (M1). In the aftermath of the Global Financial Crisis, however, despite its historic attempt, the monetary authority failed to restore the money multiplier, measured as M1 divided by the monetary base.
  • Fiscal policy: The government’s commitment to a convincing scale of fiscal programs had not been confirmed as of 2016. The rise of president-elect Donald Trump might change the course.
  • Currency Regime: Under the floating exchange rate, authorities’ intervention over exchange rate, if any, is tenure. In principle, market force is dominant in determining exchange rates.
The points above contrast the differences in the responses by the US federal government and FRB between the two cases. Although the new approach was effective in containing illiquidity at the early stage of the crisis, so far in 2016, it might prove to be ineffective in restoring the real economy in the long run. The comparison seems to imply the necessity of a direct focus on job creation. Better employment prospects would restore demand.

The infrastructure development plan suggested by president-elect Donald Trump might change this course. It might help FRB to unwind the extraordinary monetary expansion. The question is whether it needs to be comparable to the New Deal policy, or less than that. We need to remind ourselves that the Vacuum Wave required more than the New Deal to reverse. The New Deal effect turned out to be temporary. Is the Trump effect temporary as well? 

In a way, the Global Financial Crisis was different from the Great Depression. The differences addressed above accounted for milder consequences for the earlier episode than for the recent episode. In the aftermath of the Global Financial Crisis, central banks across the advanced economies deployed unprecedented monetary easing and avoided the total meltdown of the economy that unfolded in the Great Depression. Moreover, the difference in the currency exchange regime sets a totally brighter tone this time from the preceding episode. In this context, we cannot rule out the chance that the Trump effect might cause a secular reversal of the bond wave in the long run, rather than makes its temporary rebound. That said, the restoration of job creation is the key issue in substantial recovery.


Debt Magic (Negative Real Yield) Cycle

Another bond wave mapping reveals the behaviours of real value reduction of sovereign debt through inflation. This can be captured by tracing real interest rates, or real yields.

The following arguments assume that the sovereign debt is denominated in the domestic currency. With this condition strictly imposed, real yields are a measure of wealth transfer through debt arrangement: when positive, wealth is transferred from debtors to creditors; when negative, from creditors to debtors.

Positive real yields are an intuitive notion in an ordinary economic environment, simply because creditors benefit from credit creation. On the other hand, negative yields are a counter-intuitive notion, in the sense that debtors gain solely from borrowing activities. It is a technical form of debt-reduction, which is also called “financial repression” or, more casually, “inflating away,” from the perspective of sovereign debts. This debt magic is conjured by managing the inflation rate above bond yields. In doing so, two conditions need to be met: a positive inflation rate as the necessary requirement; an interest rate lower than the given positive inflation rate as the sufficient requirement. With negative nominal interest rates, real interest rates are forced to stay within a positive territory. The resulting positive real interest rates translates into the intuitive notion of the wealth transfer from debtors to creditors. That said, this becomes a constraint for a sovereign issuer when it wishes to create a negative real interest rates to manipulate the wealth transfer from the creditor to the issuer: in a straight-forward expression, when it wants to default quietly in disguise of inflation.

Both charts above projects the ex-post real yields, defined as yields minus actual inflation rate. Ex-post real yields differ from ex-ante real yields which was devised by Irving Fisher’s formulation (yields minus the expected inflation rate). For the purpose of measuring actual wealth transfer, the ex-post alternative does a better job than its ex-ante counterpart.

Based on these charts, after the turn of the 20th century, three cases of persistent negative real yields demonstrated a tendency to emerge within extreme ranges of the bond wave at both the top and bottom ends. In Chart 3.4.1, the first two cases coincided with the extraordinarily high levels of “debt-to-GDP ratio” of sovereign debt due to WWI and WWII. All three cases are associated with extraordinary shocks arising from wars (WWI, WWII) and from two oil shocks due to conflicts in the Middle East.

The case of the United States (Chart 3.4.2) also shows parallels with that of the United Kingdom.

Based on the average level of real interest rates, Carmen M. Reinhart and Maria Belen Sbrancia (2011) characterise the post-WWII period (1945 to 1980) as the period of financial repression, with bias toward negative real interest rates (Reinhart & Sbrancia, 2011): this period coincides with the Reconstruction Wave in terms of the bond wave.

It is worth noting that that it does not require large negative real interest rates in order to cause the desirable amount of debt-reduction over time. Here is an excerpt from Reinhart & Sbrancia, 2011.
“For the United States and the United Kingdom, the annual liquidation of debt via negative real interest rates amounted to 3 to 4 percent of GDP on average per year. Such annual deficit reduction quickly accumulates (even without any compounding) to a 30-40 percent of GDP debt reduction in the course of a decade.” (Reinhart & Sbrancia, 2011, p. 5)
The list below summarises our observations of the behaviour of negative real yields from the perspective of the bond wave mapping and the fiscal cycle:
 
  1. During the early stage of the post-Napoleonic War period, the Victorian Wave shows alternating occurrences of positive and negative real interest rates. Negative real yields emerge frequently until the massive legacy debt-to-GDP level [4] settled below 0.7 around 1870.
  2. After the 1870s of the Victorian Wave, with the debt-to-GDP ratio below 0.7, negative real yields are seen less often.
  3. Another case of negative real interest rates emerges for only one year at the bottom of the Victorian Wave, in the middle of the second Boer War (1899 to 1902).
  4. Within the top range of the International Gold Standard Wave, negative real yields emerge from 1915 to 1920, associated with massive funding for WWI.
  5. The Great Depression does not show negative real yields, due to deflation: positive inflation is the prerequisite for negative real interest rates. This explains some of the reasons for the protracted economic distress in its aftermath.
  6. Within the bottom range of the Vacuum Wave, negative real yields emerged from 1940 to 1943—associated with massive funding for WWII—and from 1951 to 1952, associated with the Korean War.
  7. At the top range of the Globalization Wave, negative real yields emerge during the period covering two oil shocks, again associated with military conflict in the Middle East.
  8. At the bottom range of the Globalization Wave, in the aftermath of the Global Financial Crisis, the ex-post real long-term interest rates approach 0%. Nevertheless, they do not enter negative territory. This is a manifestation of deflationary pressure, reminiscent of the Great Depression.
These experiences suggest that negative real yields might be associated with two economic factors: extreme instability emanating from military conflicts and/or a rise in sovereign debt-to-GDP ratio. Based on our observation of these two charts, the two factors might or might not coincide.
 
Ernst Juerg Weber made relevant findings regarding the short-term real interest rates experience in the United States: “a (short-term) negative real interest rate guaranteed macroeconomic equilibrium during every emergency, except the Great Depression when deflation accounted for a positive real interest rate.” In our charts, our observations on the long-term real interest rates are analogous to Weber’s remark[5]. (Weber, 2007, pp. 1-2, 10)

The exception in the case of the Great Depression is due to deflation. With nominal interest rates being negative, negative real interest rates, or debt magic, cannot be conjured. This is one of many reasons why governments fear deflation.

The long-term real yield of our time, being trapped in positive territory, might indicate long-lasting economic stagnation.


Notes
 
1. This point accords with a causal relationship between war and inflation—where war leads to inflation—addressed by a statistical inference, the Granger Causality Test, that Goldstein carried out. (Goldstein, 1988, pp. 252-253)
 
2. This definition excludes proxy wars, such as the Vietnam War, because of the absence of direct military involvement in the homelands of core power states.
 
3. According to Barry Eichengreen (2008):
“The early devaluation of the British pound helps to explain the fact that Britain’s recovery commenced in 1931. U.S. recovery coincided with the dollar’s devaluation in 1933. France’s late recovery was clearly linked to its unwillingness to devalue until 1936. The mechanism connecting devaluation and recovery was straightforward. Countries that allowed their currencies to depreciate expanded their money supplies. Depreciation removed the imperative of cutting government spending and raising taxes in order to defend the exchange rate. It removed the restraints that prevented countries from stabilizing their banking systems.” (Eichengreen, 2008, p. 87)
 
4. The high level of debt to GDP arose from extraordinary contingencies—the French Revolutionary Wars and the Napoleonic War. This might be due to a relative lag in the stabilization of inflation volatility compared with the steadily declining nominal bond yield level since the end of Napoleonic War.
 
5. Ernst Juerg Weber (Weber, 2007) offers a highly relevant insight based on his analysis on short-term interest rates for the US case. Although our subject is long-term bond yields (different from Weber’s), his remark on short-term rates is relevant to our analysis:
“A (short-term) negative real interest rate guaranteed macroeconomic equilibrium during every emergency, except the Great Depression when deflation accounted for a positive real interest rate. During the Great Depression, the interest rate mechanism failed to produce a macroeconomic equilibrium because the zero bound on the nominal interest rate implies that the real interest rate can be negative only if there is inflation. … The history of the Great Depression in the 1930s confirms that negative real interest rates were instrumental in preventing more depressions in American economic history” (Weber, 2007, pp. 1-2, 10).

Reference
  • Fischer, D. H. (2012). Fairness and Freedom: a history of two open societies, New Zealand and the United States. New York: Oxford University Press.
  • Goldstein, J. S. (1988). Long cycles: prosperity and war in the modern age. New Haven: Yale University Press.
  • Piketty, T. (2014). Capital in the twenty-first century. Cambridge, Massachusetts: The Belknap Press of Harvard University Press.
  • Reinhart, C. M., & Sbrancia, M. B. (2011). The liquidation of government debt. Cambridge, MA: National Bureau of Economic Research.
  • Shiller, R. J. (2015). Irrational Exuberance (3rd Edition ed.). Princeton, New Jersey: Princeton University Press.
  • Weber, E. J. (2007). The role of the real interest rates in US Macroeconomic History. http://ssrn.com/abstract=958188


​Copyright © 2016 by Michio Suginoo. All rights reserved.
​


Proudly powered by Weebly